Flood Hazard Map
Sign in to access the map viewer
Sign in to access the map viewer
The 100-year flood, 1% annual exceedance probability (AEP) flood, represents a flood event that has a 1% chance of occurring in any given year.
To assess river flooding risk in the Küçük Menderes Basin, we applied a hydrodynamic flood modelling approach focused on the 100-year flood event.
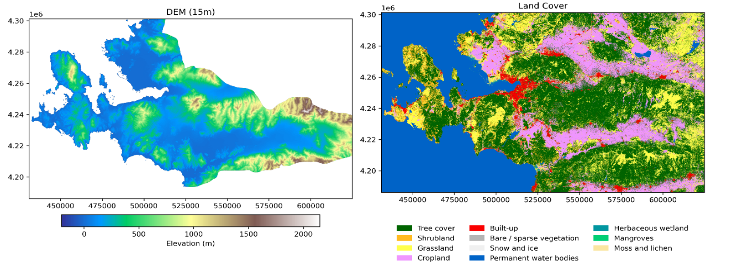
High-resolution topographic data (5 m) covering the entire basin were used to accurately represent terrain and flow paths. Land cover data (10 m) were incorporated to represent surface characteristics and assign flow resistance values across the basin, ensuring realistic flood behavior over different land uses.
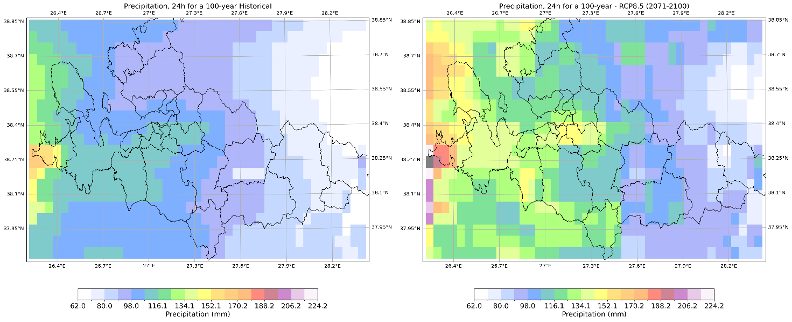
Historical 100-year extreme rainfall was derived from long-term observations at 77 meteorological stations, each with more than 40 years of data. These observations were spatially interpolated to create basin-wide precipitation maps.
Both historical and future 100-year flood events were simulated using a two-dimensional hydrodynamic flood model, producing detailed flood depth and inundation maps for the basin.
The resulting maps provide a basin-scale view of flood hazard, enabling comparison between current and future conditions. Flood protection structures and water management operations are not included in the simulations; therefore, the results represent potential flood hazard rather than actual flood damage.
This approach supports municipalities and decision-makers in understanding how 100-year flood risk may change in the future, helping inform urban planning, infrastructure design, and climate adaptation strategies.
For more information about this flood hazard assessment, please contact:
FACE Teknoloji & Mühendislik
This map is for informational and planning purposes only. The flood extent and depth data are based on modeled scenarios and may not reflect actual flood conditions. Users should consult with local authorities and conduct site-specific assessments for critical decisions. FACE Teknoloji & Mühendislik assumes no liability for decisions made based on this information.